3.2 KiB
CLAUDE.md
This file provides guidance to Claude Code (claude.ai/code) when working with code in this repository.
Project Overview
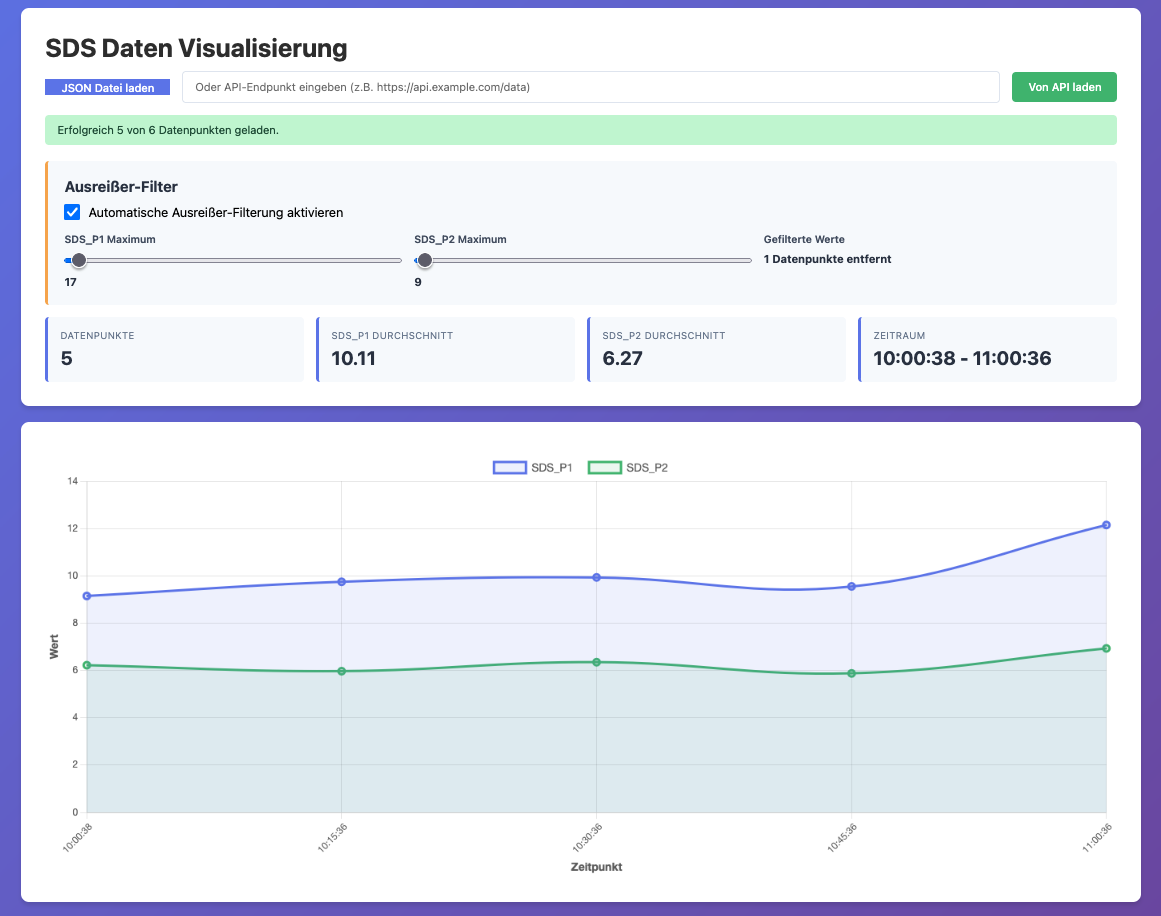
This is a single-page HTML application for visualizing SDS (Feinstaub/particulate matter) sensor data. The application is a self-contained HTML file (feinstaub.html) with embedded CSS and JavaScript, designed for deployment as a static web page.
Language: German (UI labels, documentation, and metadata are in German)
Architecture
Single-File Architecture
- feinstaub.html: Complete standalone application with embedded styles and scripts
- No build system, package manager, or external dependencies beyond CDN resources
- Uses Chart.js v3.9.1 from CDN for data visualization
Core Components
Data Processing Pipeline:
- Data input: JSON file upload or API endpoint
- Auto-detection of outlier thresholds using IQR (Interquartile Range) method
- Filtering based on user-defined or auto-detected thresholds
- Chart rendering and statistics calculation
Key Functions:
processData(jsonData): Entry point for data loading, handles different JSON formatsapplyFilters(data): Filters data based on SDS_P1 and SDS_P2 thresholdscalculateOutlierThreshold(values): IQR-based outlier detection (Q1, Q3, 1.5×IQR rule, capped at 95th percentile)autoDetectThresholds(data): Automatically sets filter thresholds based on data distributionrenderChart(): Sorts data by timestamp, applies filters, updates chart and statisticsupdateChart(labels, p1Data, p2Data): Creates/updates Chart.js line chart
Data Format
Expected JSON structure (flexible):
// Array format
[
  { Uhrzeit: "10:00:38", SDS_P1: 9.15, SDS_P2: 6.22 },
  // ...
]

// Or object with data property
{
  "data": [ /* records */ ],
  // or "records": [ /* records */ ]
}
Timestamp field detection (checked in order):
Uhrzeit(primary)timestampZeitstempelcreated_at
Development
Local Testing
# Open directly in browser
open feinstaub.html  # macOS
xdg-open feinstaub.html  # Linux
start feinstaub.html  # Windows

# Or serve via local web server
python3 -m http.server 8000
# Then visit: http://localhost:8000/feinstaub.html
Making Changes
Since this is a single HTML file with embedded scripts and styles:
- Edit
feinstaub.htmldirectly - Refresh browser to see changes
- No build or compilation step required
Testing with Sample Data
The application includes example data at the bottom of the script (lines 529-536) that loads automatically on page load for demonstration purposes.
Metadata and Attribution
Author: Joachim Hummel (Next8AI) Copyright: © 2025 Joachim Hummel Website: https://next8ai.de/sds-visualisierung/ Preview Image: https://web.unixweb.home64.de/assets/sds-preview.png
All metadata, Open Graph tags, and footer links reference the author and Next8AI branding. Preserve these when making modifications.
UI/UX Notes
- Gradient background (purple theme: #667eea to #764ba2)
- Responsive grid layouts using CSS Grid
- Auto-sizing chart container (600px height)
- Filter controls with real-time slider updates
- Statistics cards showing: data points, averages, time range, filtered count