What is in this repository?
This repository contains easily deployable monitoring solution which uses:
- Grafana (frontend for monitoring + alerts)
- Prometheus (monitoring solution pulling metrics from exporter)
- Node Exporter for Prometheus (metrics exporter-exposer for Prometheus)
- Telegraf (monitoring agent)
- InfluxDB (persistent timeseries storage)
- cAdvisor (containers monitoring)
- alertmanager (alerting)
How to use it?
If you have docker and docker-compose installed, this will take roughly 1 minute to have it up and running. If not - it will still take mentioned ~ 1 minute + time needed for docker installation.
Here is how to install:
With certificates and HTTPS (optional):
Prepare certificate in /etc/grafana/ (privkey1.pem, fullchain1.pem).
Uncomment following lines in docker-compose.yml:
...
      volumes:
        - grafana_lib:/var/lib/grafana
#        - /etc/grafana/privkey1.pem:/etc/grafana/privkey1.pem:ro
#        - /etc/grafana/fullchain1.pem:/etc/grafana/fullchain1.pem:ro
...
       environment:
         GF_AUTH_ANONYMOUS_ENABLED: "false"
         GF_SECURITY_ADMIN_PASSWORD: "nimda321"
...
#        GF_SERVER_CERT_FILE: "/etc/grafana/fullchain1.pem"
#        GF_SERVER_CERT_KEY: "/etc/grafana/privkey1.pem"
...
Also uncomment these lines in "deploy_all.sh":
## NOW LET'S SECURE GRAFANA
# CHECKING OUT ORIGINAL FILE
echo -e "checking out original docker-compose.yml"
git checkout docker-compose.yml

## STOPPING and REMOVING GRAFANA CONTAINER
echo -e "stopping & removing grafana container"
container_id=$(docker container ls | grep grafana| awk '{print $1}')
docker stop $container_id
docker rm $container_id

# REPLACING HTTP with HTTPS
echo -e "changing http to https"
sed -i 's/GF_SERVER_PROTOCOL: "http"/GF_SERVER_PROTOCOL: "https"/g' docker-compose.yml
docker-compose up -d grafana
echo -e "reverting: changing https to http"
sed -i 's/GF_SERVER_PROTOCOL: "https"/GF_SERVER_PROTOCOL: "http"/g' docker-compose.yml
Deployment:
$ ./deploy_all.sh
Monitoring should be up and running http://_**hostname**_:3000/ or https://_**hostname**_:3000/
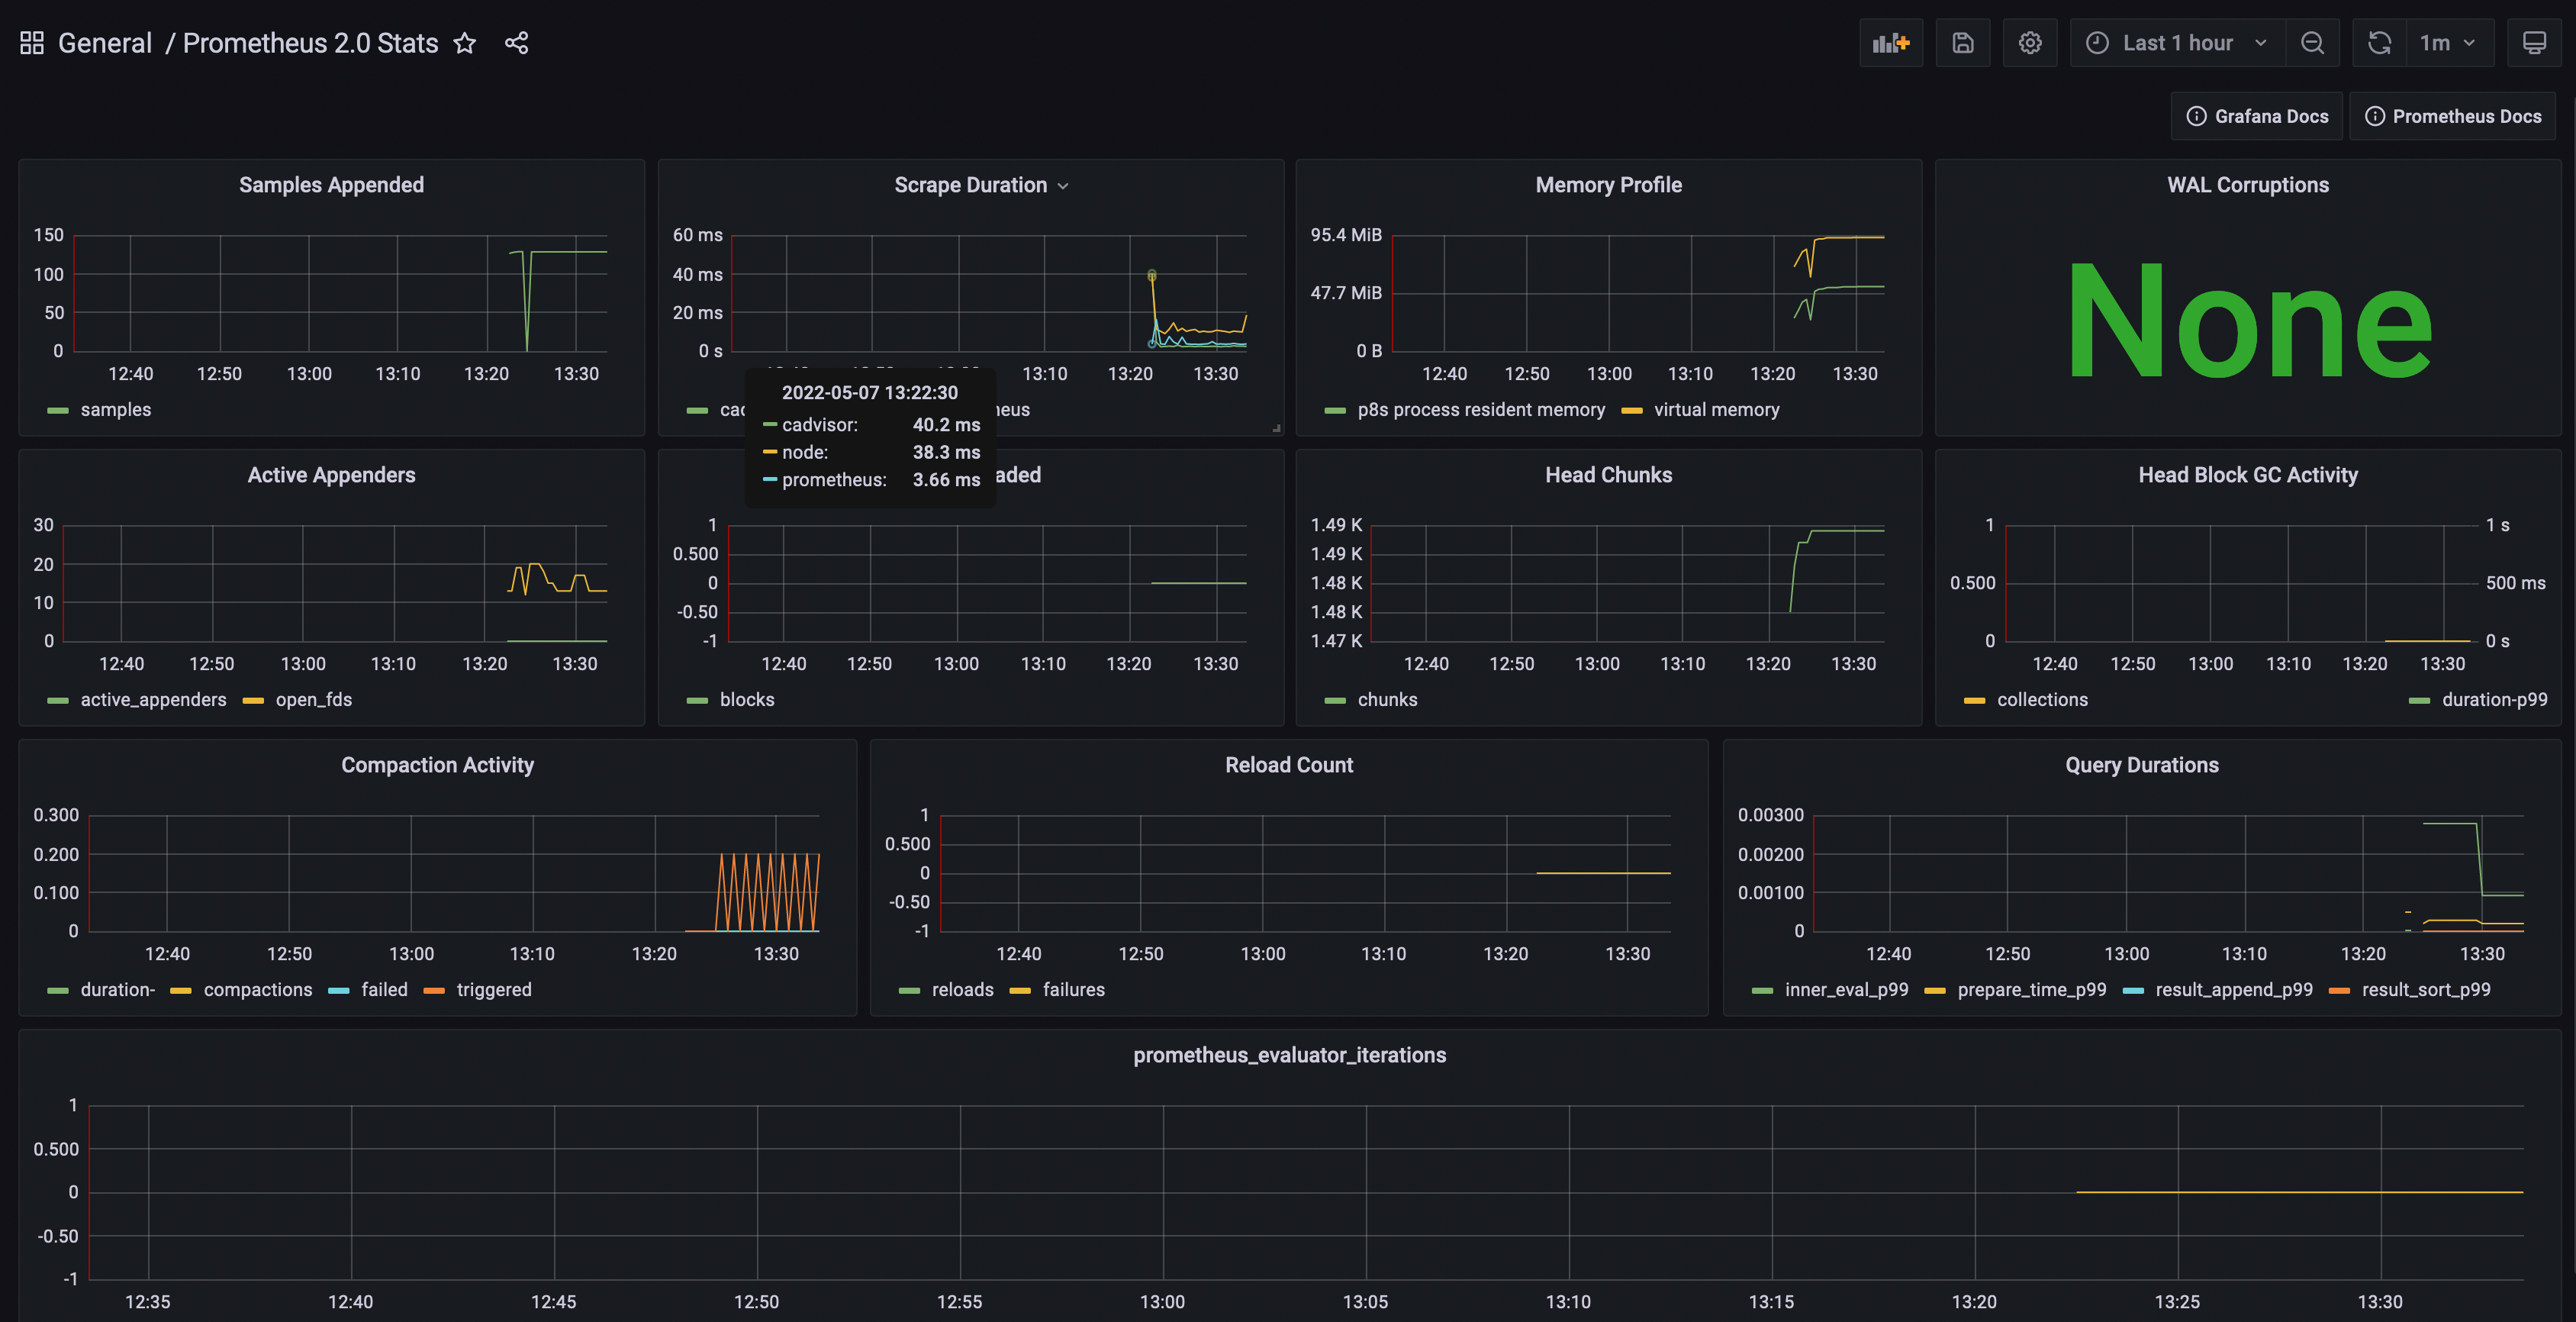
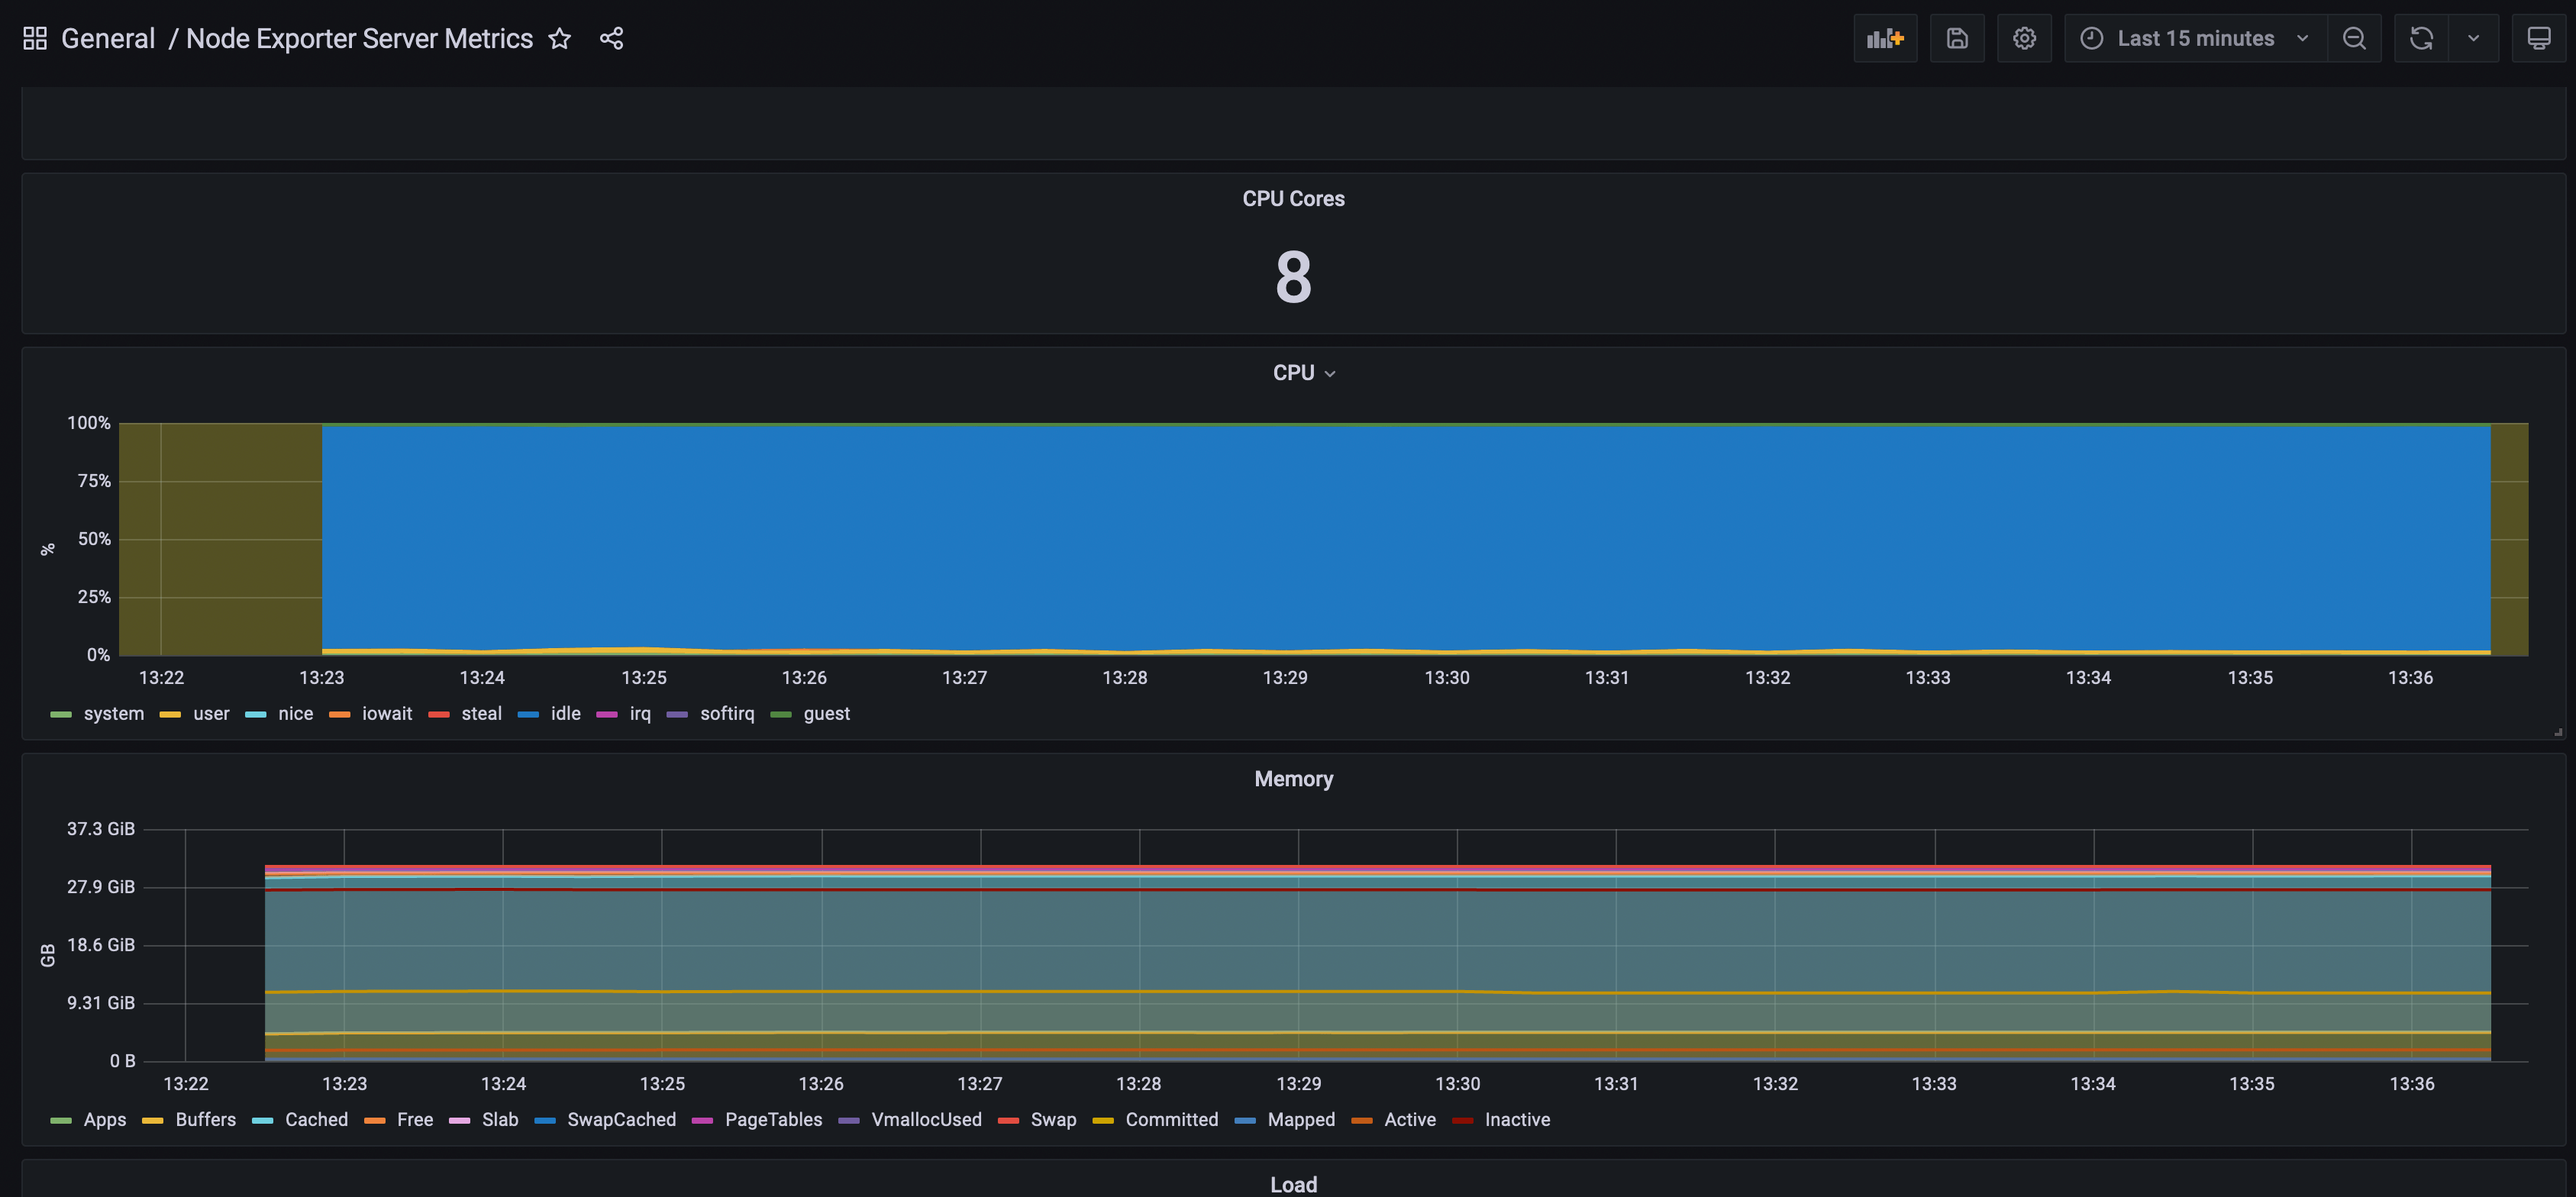
Screenshots